
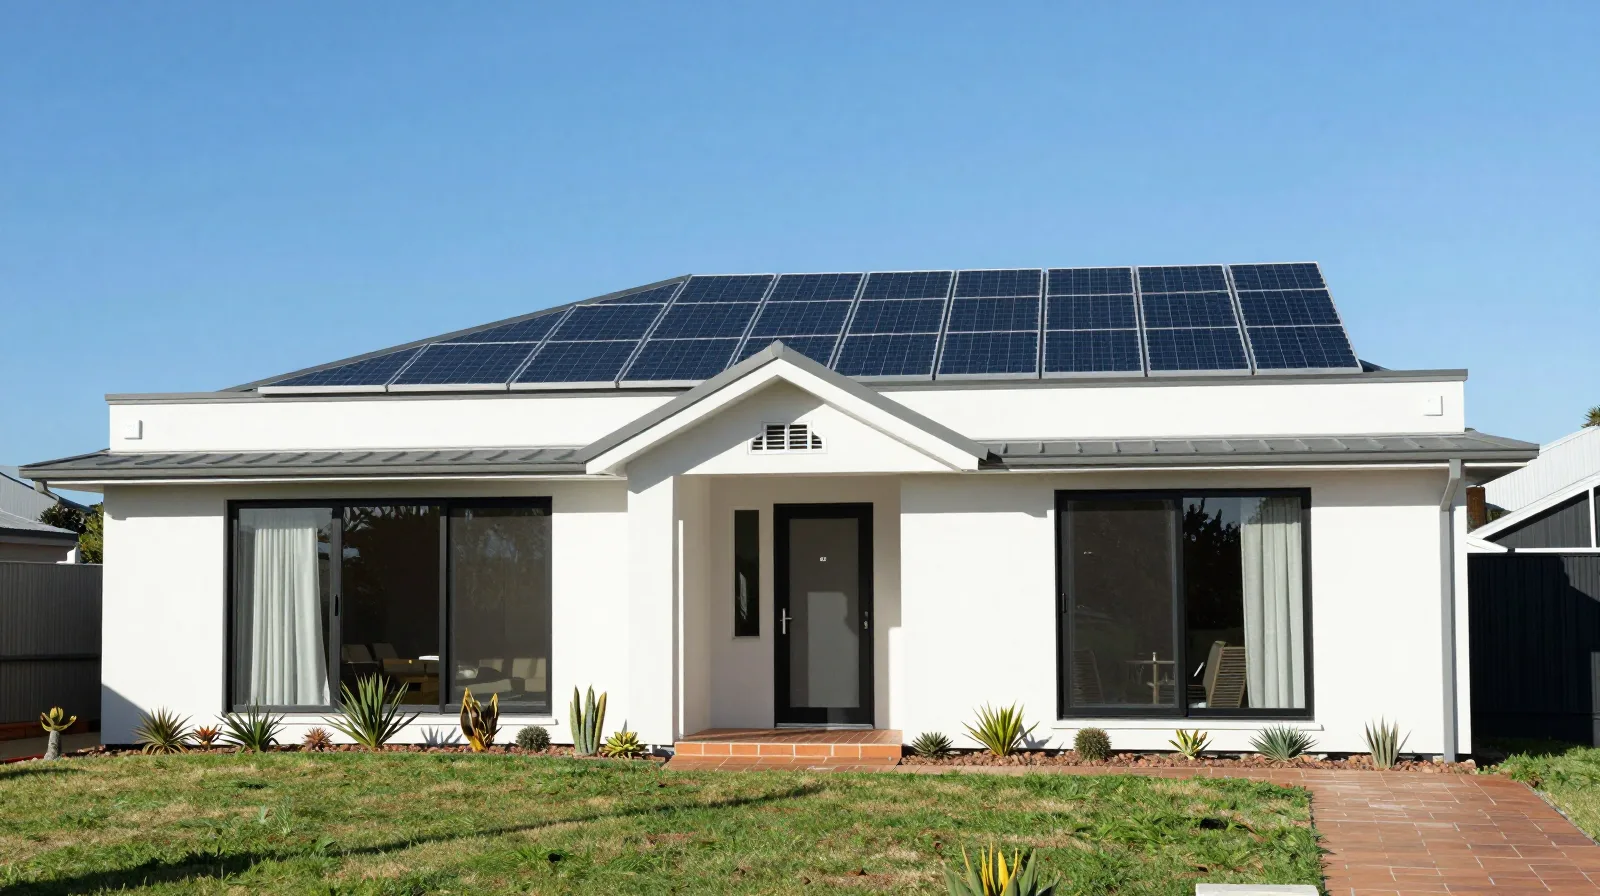
See what solar could save you, in about a minute
Move a couple of sliders and get an honest, indicative estimate: the right system size for your bill, the upfront cost after the federal STC rebate, your yearly saving, and how long it takes to pay back. No email required.
Your indicative solar savings
Adjust the inputs and the numbers update live. Every assumption behind them is listed further down the page.
Your estimate
- 0 kWRecommended system sizeSized to cover most of your daytime use
- $0Indicative cost after STC rebateUpfront, after the federal discount is applied
- $0Estimated saving per yearFrom self-consumption plus feed-in credits
- 0 yrsPayback periodTime for savings to cover the upfront cost
- $0Estimated 10-year savingsTotal saving over ten years, in today's dollars
Indicative only. This is an estimate to help you plan, not a quote or financial advice. Real figures depend on your roof, shading, energy use, tariff, the rebate value on the day and your eligibility. We confirm exact numbers in a free written quote.
The method, in plain terms
No black box. Here's exactly how the calculator gets from your bill to a savings figure, and every assumption it uses.
1. From your bill to your usage
We turn your quarterly bill into a rough daily electricity use, using a typical usage rate for your state. Bigger bill, more usage, larger recommended system.
2. From usage to a system size
We size the system to cover most of your daytime consumption without oversizing, then round to a common size. If you pick your own size, we use that instead.
3. From size to generation
We estimate how much power the system generates using average daily output per kW for your state, then adjust for your main roof direction (north is best, south least).
4. From generation to savings
We assume you use part of your solar directly (avoiding the grid rate) and export the rest for a feed-in credit. That gives an annual saving, which sets the payback and ten-year totals.
Every assumption we use
These are deliberately conservative and clearly stated. They're reasonable averages for planning, not a promise for your specific home. Rebate and certificate values move over time.
General assumptions
The calculator uses these baseline figures. Where a range exists we lean to the cautious end so estimates don't overstate savings.
- Federal STC rebate
- Priced at about $36 per certificate, 2026 deeming (5 years), applied to the system size you see.
- System price before rebate
- About $950 per kW installed, mid-market, before the STC discount. Batteries are not included in this estimate.
- Self-consumption
- 35% of generation used directly on site; the remaining 65% is exported. Conservative for a home without a battery.
- Feed-in tariff
- 5c/kWh for exported power. Rates vary by retailer and plan; some are lower, a few higher.
- Roof direction factor
- North 100%, east or west 87%, south 72% of ideal output.
- System performance
- Generation held flat over the ten-year view; no bill inflation or panel degradation is modelled, which roughly offset.
Per-state assumptions
Sun and electricity rates differ by state. We use these averages:
| State / territory | Avg output (kWh per kW per day) | Assumed grid rate (c/kWh) |
|---|---|---|
| New South Wales | 4.0 | 32 |
| Victoria | 3.6 | 30 |
| Queensland | 4.2 | 30 |
| South Australia | 4.2 | 38 |
| Western Australia | 4.4 | 30 |
| Tasmania | 3.3 | 29 |
| Australian Capital Territory | 4.0 | 30 |
| Northern Territory | 4.6 | 28 |
Generation figures are indicative daily averages per kW after typical losses. Grid rates are rough single-rate averages for planning. Both vary by location, retailer and season. Sources for the rebate figures are on our rebates page.
Ready for figures we'll stand behind?
A quick call or online quote and we'll turn this estimate into exact figures for your roof, your energy use and the rebates you qualify for.